Club Activity 3
SWIM and XR being used as a measurement tool
Introduction
The SWIM is a system that can be used to represent the virtual world in the real world, building upon Dr. Steve Mann's pioneering work. This project explores the intersection between wearable technology and immersive environments to create new alternatives for augmented reality applications. Furthermore, part of this activity is to understand comparametric equations, the fundamental basis of HDR. The comparametric equation is a type of equation where the same type of function can appear multiple times but with different inputs allowing us to compare the fucntion without involving the input variable.
Electrical Schematic:
The image shows the wiring of a photocell connected to an Arduino board. The setup also includes an LED strip, with its 5V and Ground connected to the Arduino.
The signal wire of the LED strip is linked to the Arduino’s signal pin.

Methodology:
1. Experimental Setup
We used an LED light strip controlled via an Arduino microcontroller, measuring brightness using a photocell in a voltage divider circuit. The experiment was conducted for multiple colors (red, blue, green, white, and additional combinations) to analyze brightness levels.
2. Light Strip Illumination & Brightness Adjustment
- The LED strip was first illuminated to half its total length, then it was then fully illuminated.
- The brightness was varied incrementally across different intensity levels through an automated process.
3. Data Collection
- A photocell in a voltage divider configuration recorded voltage values corresponding to brightness levels.
- Data was logged using either CoolTerm for serial data capture or timestamped directly within Arduino.
- Multiple trials (at least 10, but more were encouraged) were conducted for statistical reliability.
4. Data Analysis & Visualization
- The collected brightness values for half-illuminated and fully-illuminated strips were plotted, with the half-lit brightness on the x-axis and full-lit brightness on the y-axis.
- A reference 45-degree line was included for comparison.
- The plot was structured to be isomorphic on both axes, ensuring comparability.
- The resulting data formed a comparametric equation plot, characterizing the light strip’s brightness response.
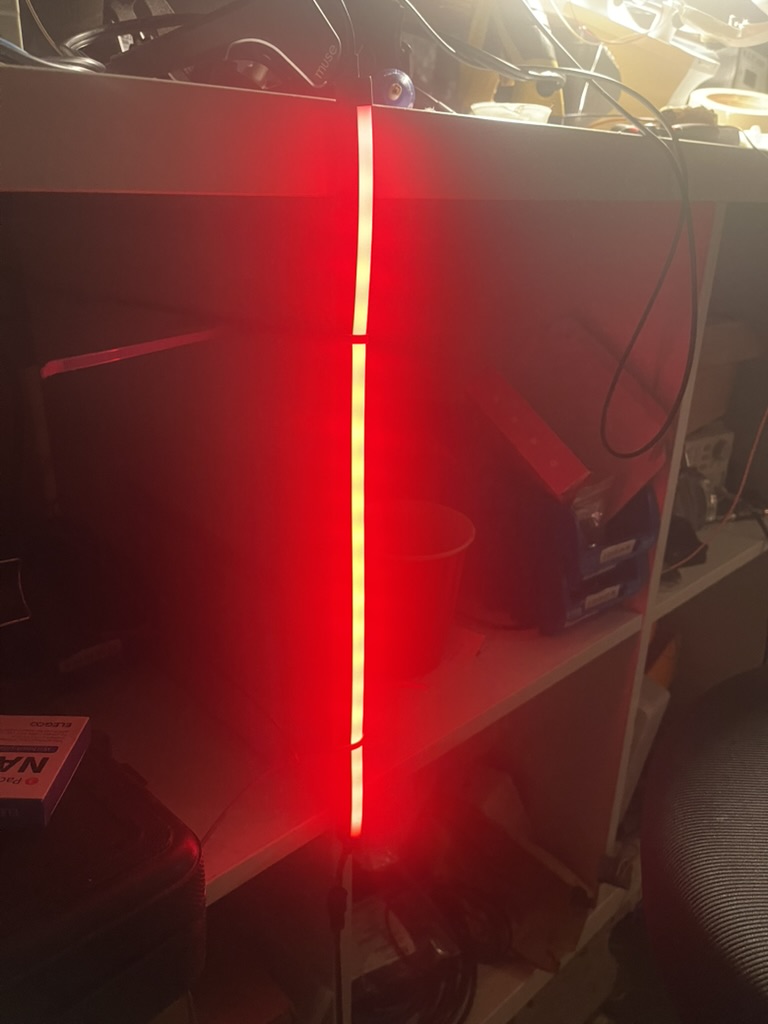
Figure 1: Red LED strip illuminated
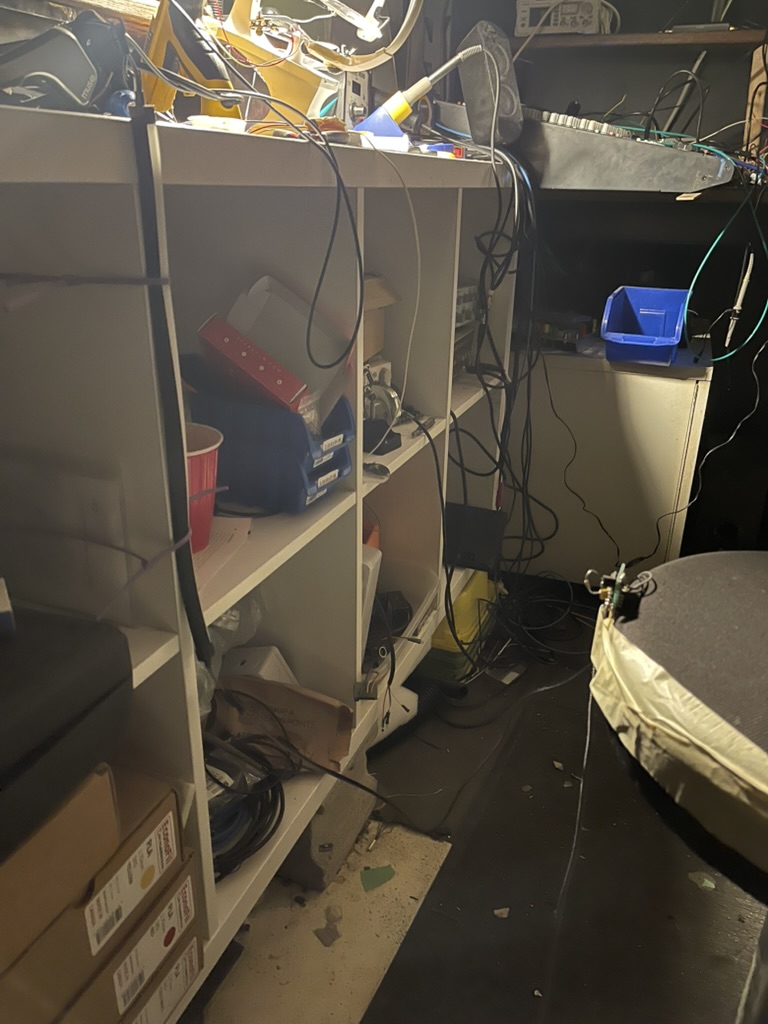
Figure 2: Setup for the experiment to keep the photocell and the LED strip at the same distance
Preliminary Results:
Here are some of the results that were obtained based on the experiment above done with only one cycle:

Showcase of the Activity:

Figure 3: Danilo and Anne's Scatter Plot Results